
Since 2000, there have been three recessions in the United States — the Dotcom recession from March to November 2001, the Great Recession from December 2007 through June 2009, and the COVID recession that started in February 2020.
There have also been four bear markets since 2000 — from 2000 to 2002, from 2007 to 2009, during the COVID outbreak in 2020, and in 2022.
Through those shocks, which mostly align with one another, markets have endured and grown. There is no better gauge of that, perhaps, than the Vanguard Morningstar Total Stock Market ETF (VTI -0.50%).
Image source: Getty Images.
This ETF tracks the Morningstar U.S. Total Market Index, which measures the performance of the entire U.S. equity market, spanning mega-, large-, mid-, small-, and micro-cap stocks.
So, with some 3,500 holdings, this ETF tracks the entire market and has done so since it launched in 2001.
VTI versus the S&P 500
So, how has the ETF performed over the years? Since its inception on May 24, 2001, the Vanguard Morningstar Total Stock Market ETF has had an average annualized total return of 9.6%.
That’s actually better than the S&P 500 over that same time period, as the chart below shows.
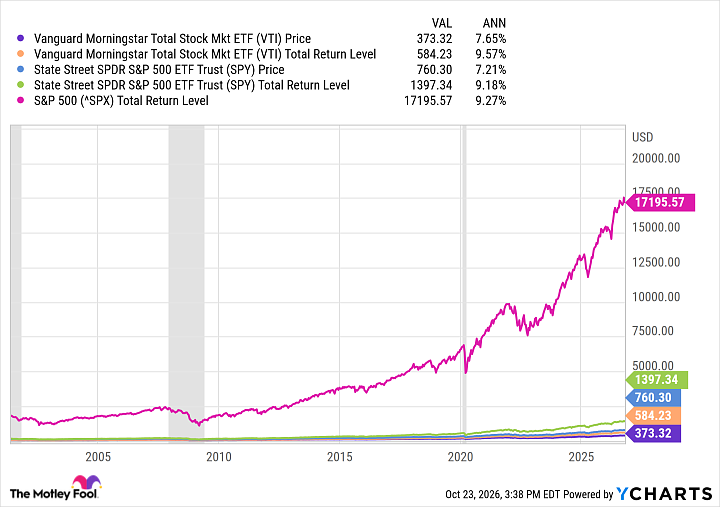
So, through all the recessions and bear markets over the past 25 years, the total market still returned almost 10% per year.
VTI Vanguard Morningstar Total Stock Market ETF
$373.01-$1.89 (-0.50%)
NYSEMKT · As of 4:00 PM ET 10/23/26
If you had invested $10,000 in VTI 25 years ago, just a few months after the ETF launched, that investment would have grown to about $215,000 today, assuming a 9.6% annual return and a $ 100-per-month contribution.
That really drives home the importance of staying invested, because no matter what the economy or markets throw at us, the U.S. stock market not only endures, but grows over time.